Simplify and streamline troubleshooting your kubernetes cluster with Komodor

Troubleshooting your Kubernetes Cluster and the resources within has never been this easy. This blog post provides an overview of Komodor; a new kind of platform.
When you are using Kubernetes, you will sooner or later run into the problem of having to debug an application with multiple dependencies across your cluster. This can be a highly time-consuming and difficult task, which is made harder by linked dependencies between your Kubernetes resources. In this case, one resource might throw errors while the underlying cause lies within a completely different resource or change that appears to be healthy.
To properly debug those scenarios, we want to make use of cloud native tools and platforms that provide us with visibility into our cluster and context on the resources running within. One of these tools is Komodor.
Komodor is a troubleshooting platform for Kubernetes-based environments. It tracks changes and events across the entire system's stack and provides the needed context to troubleshoot issues efficiently.
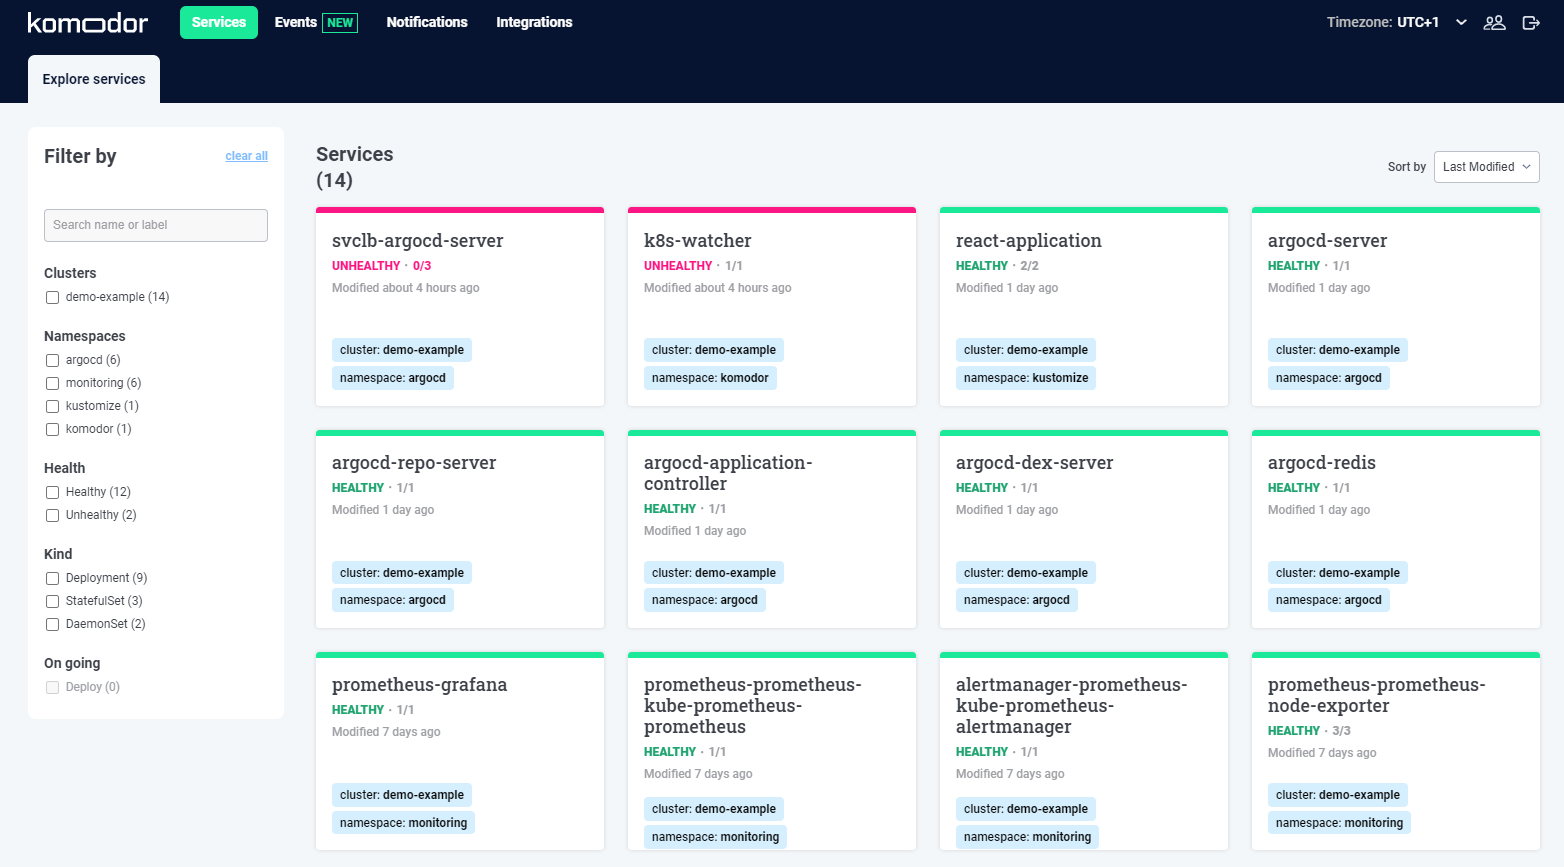
Komodor Dashboard Overview Service Explorer
This blog post will
- Introduce you to Komodor and provide you with an overview of the platform
- Showcase how you can connect your Kubernetes cluster with Komodor
- Detail additional features provided by Komodor
Komodor Overview
Komodor allows us to gain the highest visibility into the resources that are running within our cluster. Once we provide the platform with access to our cluster [read-only permissions], we will see
- Any changes that took place
- The resources that were changed
- Who made changes to our resources
- The timeline of those changes
- The health status of our Kubernetes resources
- Kubernetes resource logs [down to the pod level]
- This information helps us to gain an overview of our resources. In case that something goes wrong, we will have the information and tools to quickly troubleshoot our processes and deployments.
Who should use Komodor and why?
While the use of Komodor requires an organisation to already have shifted or being in the process of shifting to Kubernetes, anyone who is interacting with Kubernetes deployments will benefit from Komodor. Overall, Komodor is a highly versatile tool. It can be used by DevOps and SRE teams to gain additional insight into the current state of our cluster but also help Developers to better understand the link between changes in Git and the deployed resources.
Currently, the most common troubleshooting tools are “kubectl” and k9s or similar tools that provide an overview of the cluster and the resources running within. The problem with those tools is that they have a steep onboarding curve and require engineers to manually query the resources within the cluster to find the underlying cause of an error. Similarly, those tools not only allow to view resources but also to delete resources. Having to debug an application at 3 AM and digging through the logs to find the resources that are not operating correctly can easily introduce more errors.
Furthermore, Komodor provides additional, curated information from across different integrations. With this, it is used in addition to Monitoring solutions, such as Grafana. Monitoring solutions provide a picture of what is going on within the cluster. However, most require users to manually understand the changes that took place by viewing Git events and connecting those to the metrics. As you can imagine, this can result in a lot of guesswork and solutions by trial-and-error. For this purpose, Komodor provides a unique solution. As an SRE, I enjoy having a single go-to-place where I can integrate other tools and see the combined data output of those. During an incident, I am then quicker to understand past events and changes made to the resources within our cluster.
Komodor provides an easy to use overview of the cluster state and resources within. Using monitoring and manual troubleshooting solutions often requires comprehensive onboarding and sometimes even years of experience. How often does a developer have to use PromQL to query Prometheus or kubectl to view Kubernetes event logs? Through Komodor, developers are able to view the aggregated information from several tools to easily understand how the changes deployed in Git affect resources running within the cluster. Also, novice developers, who have never worked with Kubernetes directly, will not require subject-specific knowledge to use Komodor.
Getting started
This section will provide an overview of Komodor and its features.
At the time of writing this blog entry, Komodor does not provide a “self-serve” installation. To gain access to the platform itself, you can register your interest through a simple sign-up flow and then start your free trial.
Prerequisites:
- Helm installed
- A Kubernetes Cluster
- Access to the Komodor Platform
Before we get started, you need to have a Kubernetes cluster. Ideally, your cluster already has resources installed which will make it easier to view all the features available by Komodor. In our case, we are going to use our Civo Kubernetes cluster. Have a look at the following guide on setting up an account and creating a cluster (it should not take longer than 2min -- the time it takes to spin up a Civo Kubernetes cluster ;) ).
Once signed into the platform, we are provided with the dashboard. Without integrating a Kubernetes cluster, there is little that we can do with the platform. Thus, the next step will be to connect our Kubernetes cluster with Komodor. This is done by installing the Komodor Agent into our cluster. Like other cloud native deployments, the Agent is a simple Helm Chart that we will install within our Komodor namespace. Helm is a package manager for Kubernetes; think about it as a way to pack up a set of Kubernetes YAML manifests and deploy those effectively through the command line.
You can find the documentation for the Helm Chart in the following GitHub repository. The Helm Chart can become handy if you want to modify further values in the Values.yaml file. However, this is something that we will not have to do for the purpose of this tutorial. To connect your Kubernetes cluster to Komodor, the Helm Chart requires several values; one of those values is the API KEY.
You can find the API KEY on your dashboard by registering a new cluster. Simply provide the cluster name and you will receive the commands filled out with the necessary information. Note that the actual cluster name and the name that you provide Komodor do not have to be exactly the same. However, we will provide the same name to avoid confusion.
Commands provided to install the Helm Chart:
helm repo add komodorio https://helm-charts.komodor.io helm repo update helm upgrade --install k8s-watcher komodorio/k8s-watcher --set apiKey=YOUR_API_KEY_HERE --set watcher.clusterName=CLUSTER_NAME
You can find the API key by accessing the Integrations section in the Dashboard:
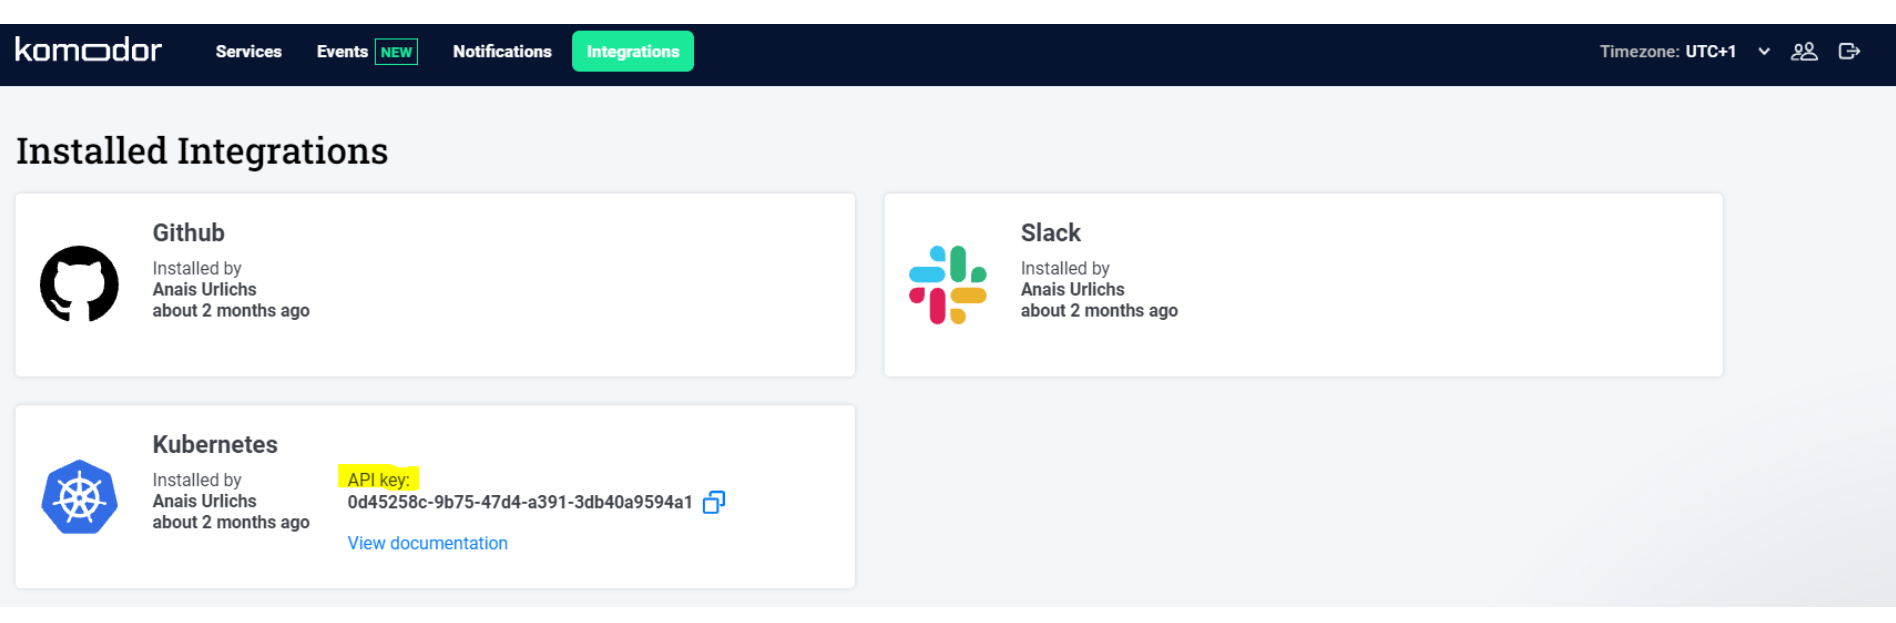
API Key from the integrations section
Your terminal output should be similar to the following:
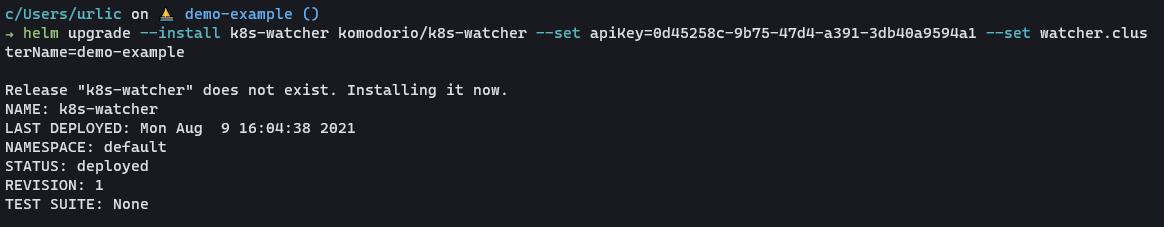
Komodor Helm Chart installation with specific values
The Komodor Dashboard
Now that we have added Komodor to our cluster, the agent will push information out of our cluster to the Komodor platform. This is a more secure model than accessing the Kubernetes cluster from outside.
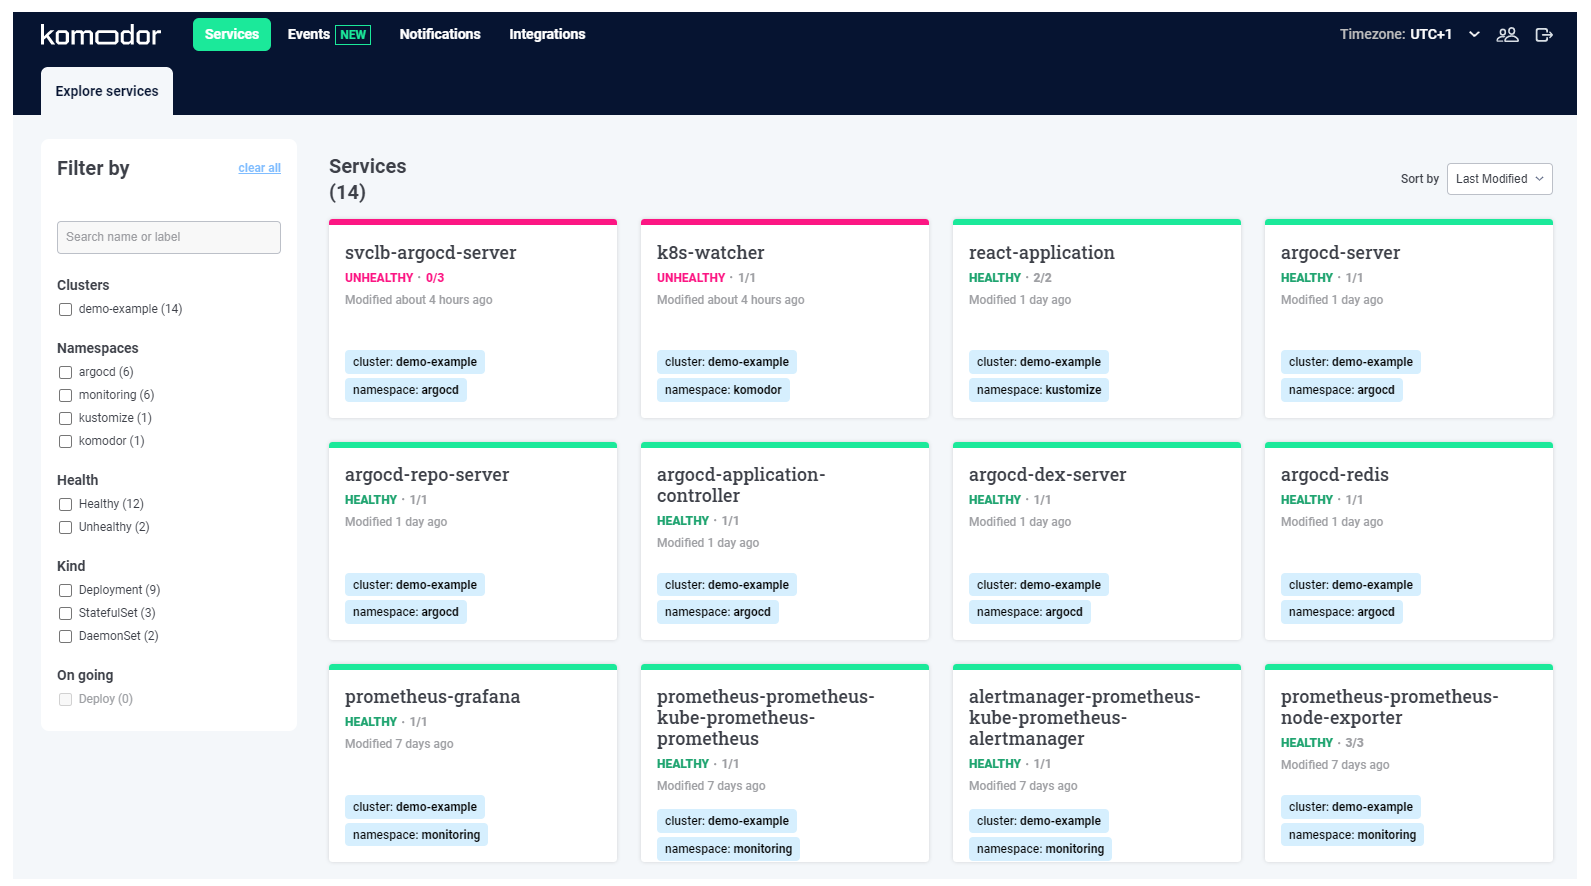
Komodor Dashboard Overview Service Explorer
Filters
Let’s take a closer look at the filter section on the left side of the dashboard. As you can see in the screenshot below, we can filter not only per cluster but also per namespace, health and type of deployment. In case that you have multiple environments or a multi-cluster set-up, this will be extremely useful. You can even create your own customizable filters that make sense to your use case.
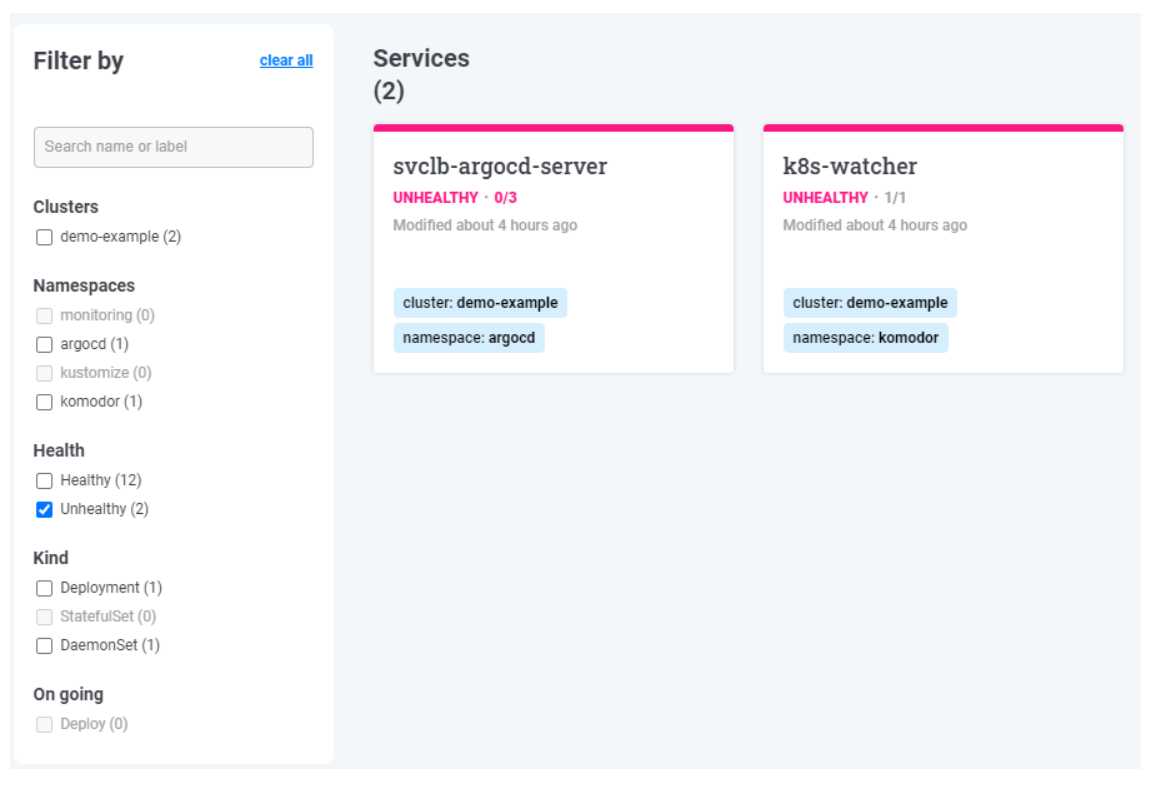
Option to filter resources in the UI
Time zone
It is worth mentioning the level of considerations taken in the design of the platform. Working with a remote team, not all team members are going to be in the same time zone. Komodor makes it really easy to change the timezone in the top right of the Dashboard.
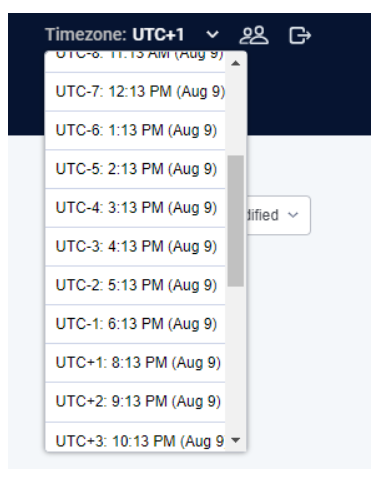
Select your timezone in the Dashboard
Services
Next, we can click into a specific service to see further detail on
- The state of the service
- Any changes that have been made to the service over time
- Related services
In case that one of the services goes down without showing any visible changes, it is often useful to check related resources and the changes that have been made to those. A change in another Kubernetes resource might trigger a part of our cluster and resource that we would not necessarily think of.
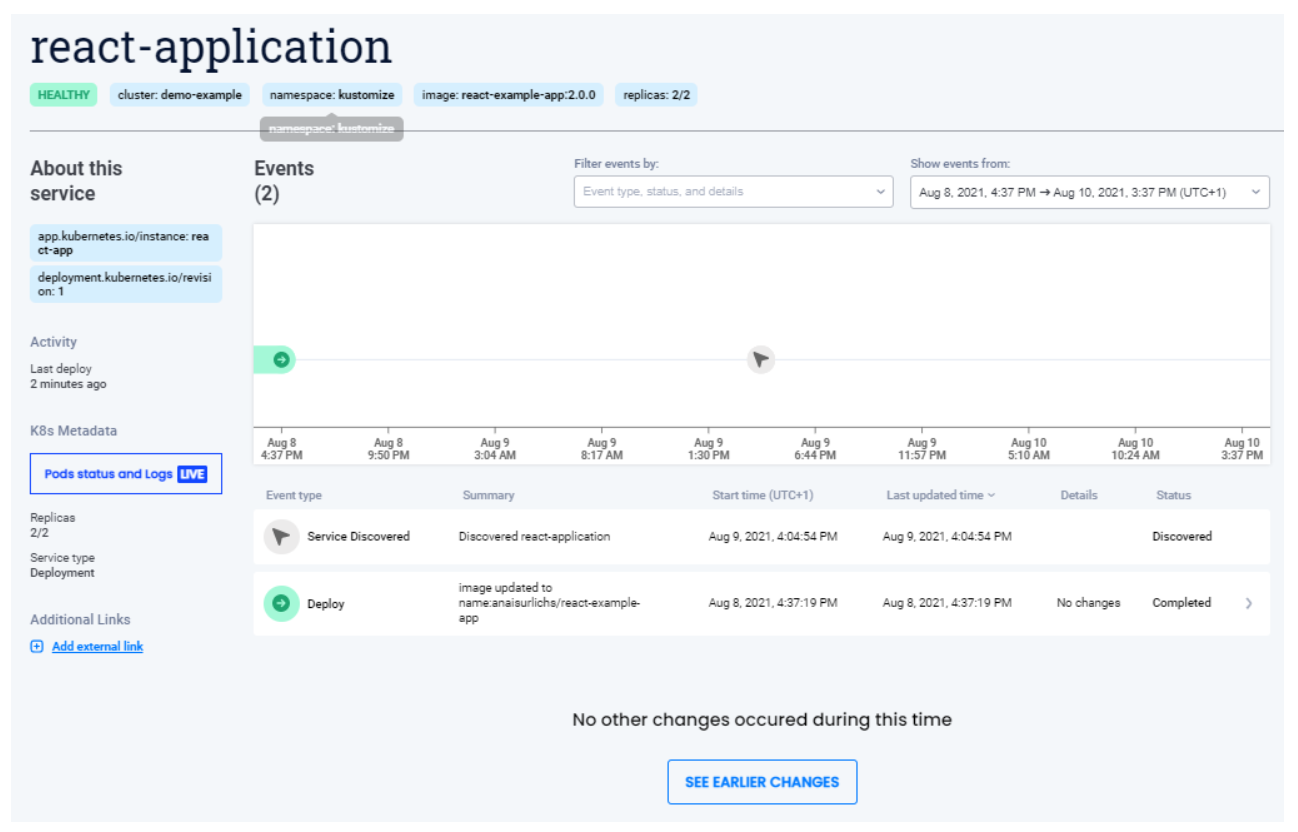
UI of specific service, showing deployment and service discovery
Furthermore, by selecting related services, it is possible to overlay the events of multiple services to find correlations between Events and Services fast. This makes it even easier to debug the changes that happened within your cluster.
Live Pod Status and Logs
From the specific service, we can click into the pods that are connected to the service “Pods status and Log” on the left of the UI. This will provide us with the Description, Logs, and Events related to the service. These are usually information that you either find through a combination of kubectl commands or by using specific tools such as k9s. However, Komodor is the first platform (that I came across) with a comprehensive UI that provides intuitive access to the logs and events of individual pods.
To access this feature, we will have to enable the following flag in the Komodor Agent Helm Chart: watcher.enableAgentTaskExecution
helm upgrade — install k8s-watcher komodorio/k8s-watcher — set watcher.enableAgentTaskExecution=true — reuse-values
Once enabled, you will see your resource, events, and logs:
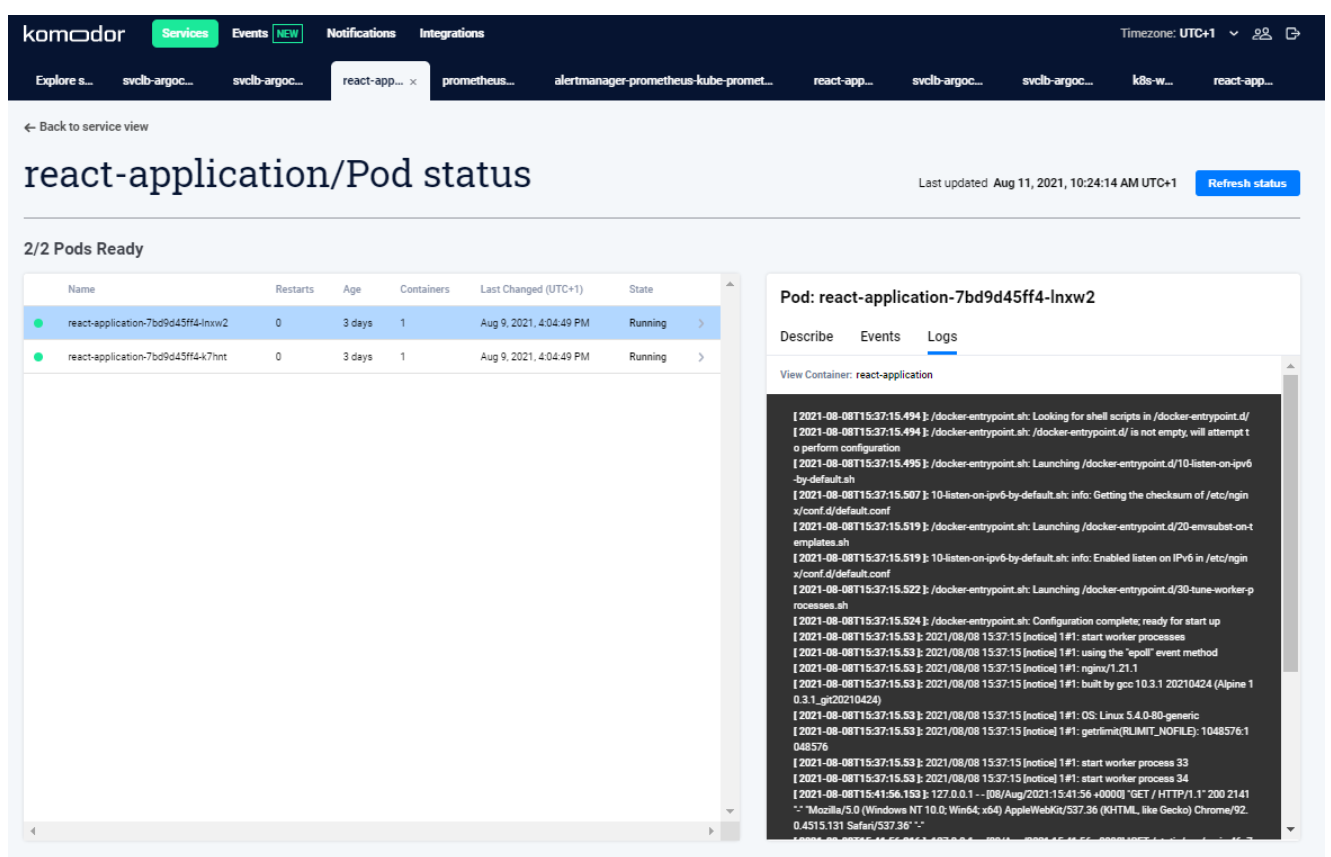
Live Status and Logs of the Pods
Events
While the Services section provides an overview of the different services running within our cluster to receive the highest insights into specific resources, the Events section displays the changes that have occurred within our cluster over time. Additionally, the Events section allows us to combine resources and see all events, regardless of the cluster or resource, selected. Those events may include any changes in our deployments or information on resources within our cluster. The information is largely provided by our integrations.
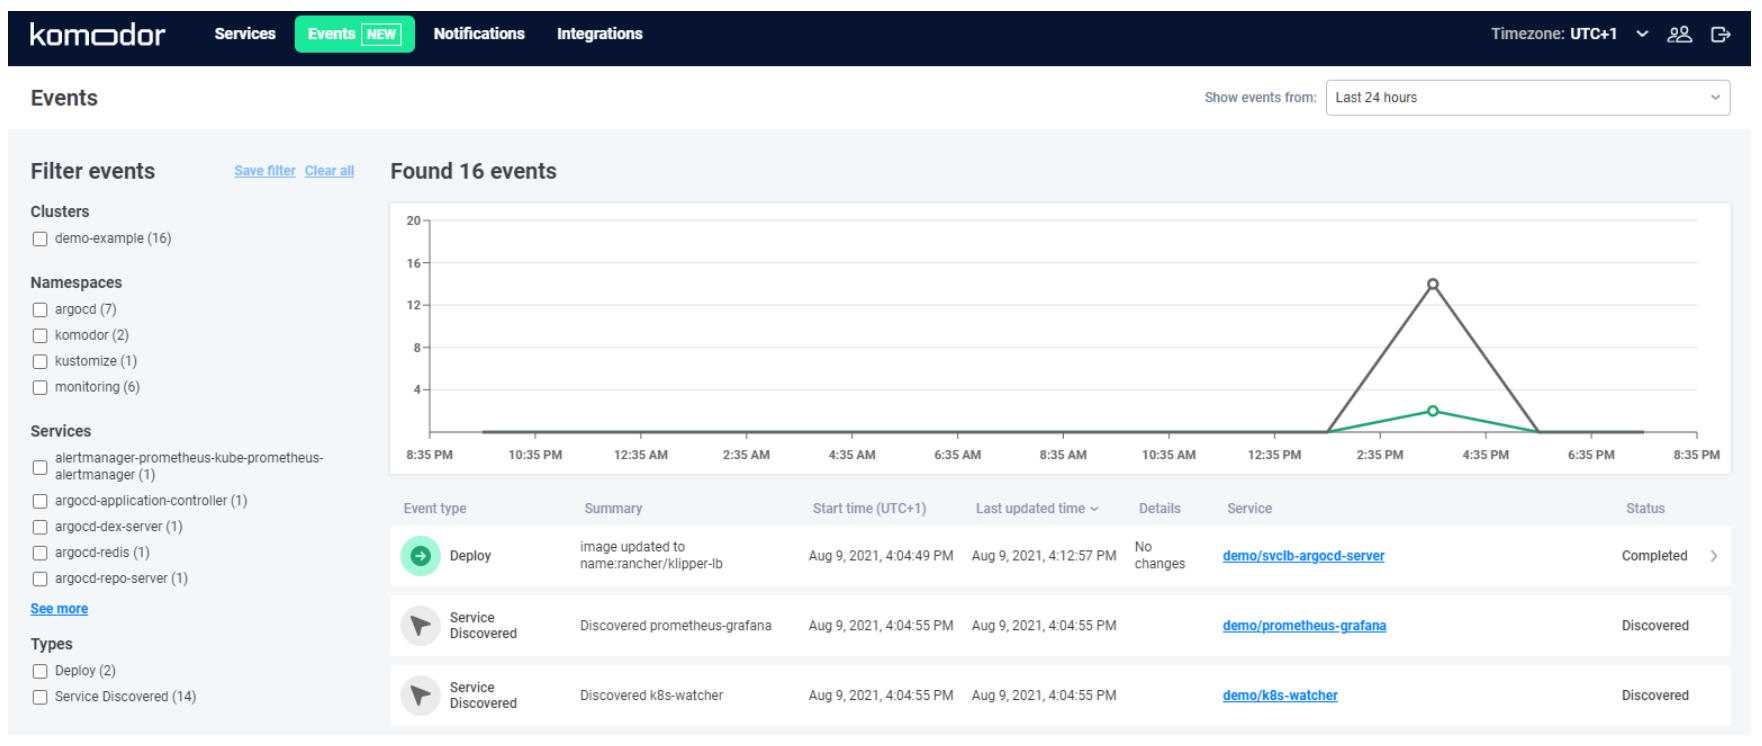
Events section in the Komodor Dashboard
By selecting a specific event, we can see further information on the Git or a similar event that took place:
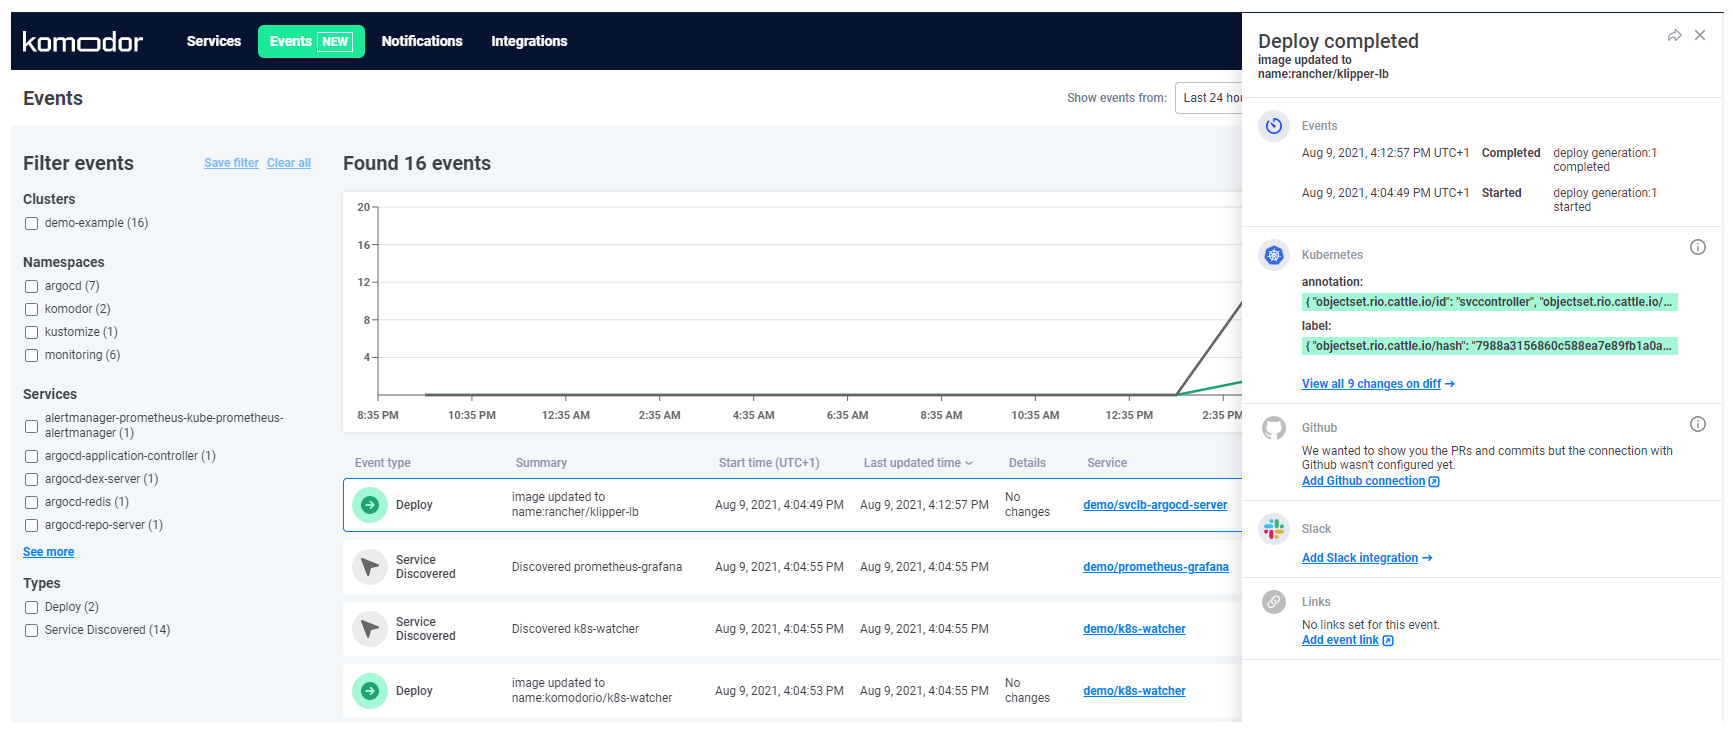
Events section with further details on deployments
Note that Komodor does not only track automatic changes that have taken place through Git but also manual changes that have been directly applied to the cluster. Thus, if someone makes any changes directly to the cluster without pushing to Git, those changes will also become visible within the Dashboard.
Each section has a link that will provide you with specific documentation on setting up the integration. Most of the integrations simply require users to add annotations and labels to their Kubernetes Deployments. Once you have set up the integration with Git and Slack, you will receive further information on events.
Integration
The last section that I want to highlight is the integration section. Regardless of how good a tool is, if it does not provide the right integrations with other tools and platforms, it is likely going to be of little use.
This is not the case with Komodor, which offers several integrations with related monitoring and troubleshooting tools. Once you set up a new integration, it will provide additional data points to your Services and Events.
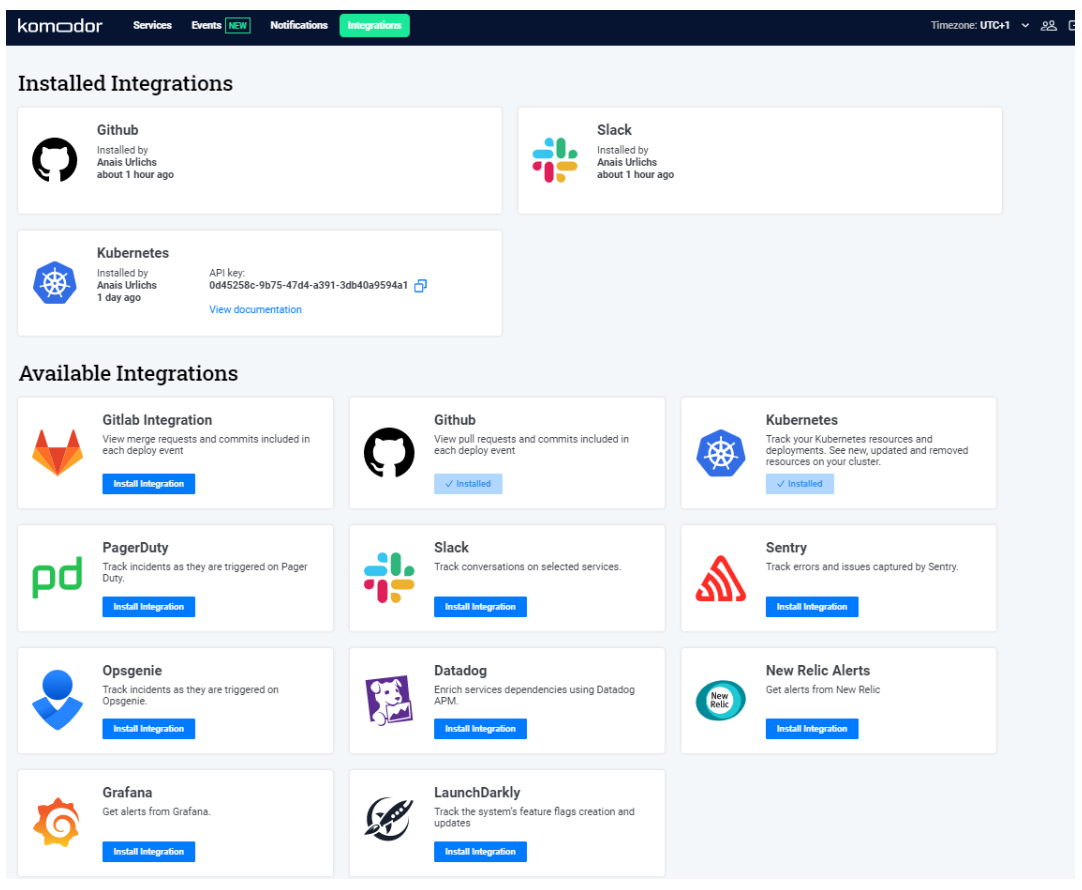
Komodor integration page
Integrating with Slack requires you to
Give Komodor Access to your Slack Account Add the necessary annotations to your deployments e.g.
app.komodor.com/notification.deploy.slack: "#deploy"

app.komodor.com/notification.alert.slack: "#p1-health-issues"
Done!
Komodor provides you with the possibility to add custom rules within the annotations. Thank you for go through this article.


